

The most Powerful DNA amplification technology known as on date In molecular biology first described by (Higuchi, 1992; Higuchi, 1993). Real-Time Polymerase Chain Reaction, also called quantitative Real Time Polymerase Chain Reaction (qPCR) or kinetic polymerase chain reaction, is a laboratory technique based on the polymerase chain reaction, which is used to amplify and simultaneously quantify a targeted DNA molecule. It enables both detection and quantification (as absolute number of copies or relative amount when normalized to DNA input or additional normalizing genes) of a specific sequence in a DNA sample.
The procedure follows the general principle of polymerase chain reaction; its key feature is that the amplified DNA is quantified as it accumulates in the reaction in real time after each amplification cycle. Two common methods of quantification are the use of fluorescent dyes that intercalate with double-stranded DNA, and modified DNA oligonucleotide probes that fluoresce when hybridized with a complementary DNA.
Frequently, Real Time Polymerase Chain Reaction is combined with reverse transcription polymerase chain reaction to quantify low abundance messenger RNA (mRNA), enabling a researcher to quantify relative gene expression at a particular time, or in a particular cell or tissue type.
Although Real Time Quantitative PCR is often marketed as RT-PCR, it should not be confused with reverse transcription polymerase chain reaction, also known as RT-PCR.
Background
Real time quantitative PCR uses fluorophores in order to detect levels of gene expression.
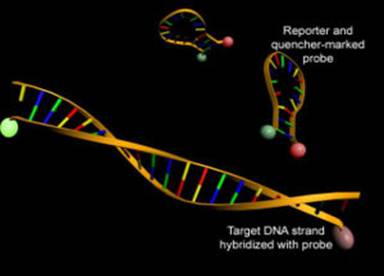
Figure 1. Example of a fluorescent probe.
Cells in all organisms regulate their cellular activities by activating or deactivating the expression of their genes. Gene expression is usually directly proportional to the number of copies of messenger RNA (mRNA) of a particular gene in a cell or tissue.
Traditionally, the expression level of a gene has been estimated by visualizing the abundance of its mRNA transcript in a sample with a technique called northern blotting. In this method, purified RNA is separated by agarose gel electrophoresis, transferred to a solid matrix (such as a nylon membrane), and probed with a specific DNA probe that is complementary to the gene of interest. Although this technique is still used to assess gene expression, it requires relatively large amounts of RNA and provides only qualitative or Semi-Quantitative information of mRNA levels.
In order to robustly detect and quantify gene expression from small amounts of RNA, amplification of the gene transcript is necessary. The polymerase chain reaction is a common method for amplifying DNA; for mRNA-based PCR the RNA sample is first reverse transcribed to cDNA with reverse transcriptase.
Development of PCR technologies based on reverse transcription and fluorophores permits measurement of DNA amplification during PCR in real time, i.e., the amplified product is measured at each PCR cycle. The data thus generated can be analysed by computer software to calculate relative gene expression in several samples, or mRNA copy number. Real-time PCR can also be applied to the detection and quantification of DNA in samples to determine the presence and abundance of a particular DNA sequence in these samples.
Real-time PCR using double-stranded DNA dyes A DNA-binding dye binds to all double-stranded (ds)DNA in a PCR reaction, causing fluorescence of the dye. An increase in DNA product during PCR therefore leads to an increase in fluorescence intensity and is measured at each cycle, thus allowing DNA concentrations to be quantified. However, dsDNA dyes such as SYBR Green will bind to all dsDNA PCR products, including nonspecific PCR products (such as "primer dimers"). This can potentially interfere with or prevent accurate quantification of the intended target sequence.
The reaction is prepared as usual, with the addition of fluorescent dsDNA dye.
The reaction is run in a Real Time Thermal Cycler, and after each cycle, the levels of fluorescence are measured with a detector; the dye only fluoresces when bound to the dsDNA (i.e., the PCR product). With reference to a standard dilution, the dsDNA concentration in the PCR can be determined.
Like other real-time PCR methods, the values obtained do not have absolute units associated with it (i.e. mRNA copies/cell). As described above, a comparison of a measured DNA/RNA sample to a standard dilution will only give a fraction or ratio of the sample relative to the standard, allowing only relative comparisons between different tissues or experimental conditions. To ensure accuracy in the quantification, it is usually necessary to normalize expression of a target gene to a stably expressed gene (see below). This can correct possible differences in RNA quantity or quality across experimental samples.
Real-time PCR monitors the fluorescence emitted during the reaction as an indicator of amplicon production during each PCR cycle (ie, in real time) as opposed to the endpoint detection. The real-time progress of the reaction can be viewed in some systems. Real-time PCR does not detect the size of the amplicon and thus does not allow the differentiation between DNA and cDNA amplification, however, it is not influenced by non-specific amplification unless SYBR Green is used (see below). Real-time PCR quantitation (qPCR) eliminates post-PCR processing of PCR products (which is necessary in competitive RT-PCR). This helps to increase throughput and reduce the chances of carryover contamination. In comparison to conventional RT-PCR, real-time PCR also offers a much wider dynamic range of up to 107-fold (compared to 1000-fold in conventional RT-PCR). Dynamic range of any assay determines how much target concentration can vary and still be quantified. A wide dynamic range means that a wide range of ratios of target and normalizer can be assayed with equal sensitivity and specificity. It follows that the broader the dynamic range, the more accurate the quantitation.
The real-time PCR system is based on the detection and quantitation of a fluorescent reporter (Lee, 1993; Livak, 1995). This signal increases in direct proportion to the amount of PCR product in a reaction. By recording the amount of fluorescence emission at each cycle, it is possible to monitor the PCR reaction during exponential phase where the first significant increase in the amount of PCR product correlates to the initial amount of target template. The higher the starting copy number of the nucleic acid target, the sooner a significant increase in fluorescence is observed. A significant increase in fluorescence above the baseline value measured during the 3-15 cycles indicates the detection of accumulated PCR product.
Usually the protocol followed is depicted in Figure 2.
Figure 2. Example of a protocol usually followed in Real Time PCR.
There are three main fluorescence-monitoring systems for DNA amplification 7 (Wittwer, 1997a):
Hydrolysis probes include TaqMan probes (Heid, 1996), molecular beacons (Mhlanga, 2001; Vet, 2002; Abravaya, 2003; Tan, 2004; Vet & Marras, 2005) and scorpions. They use the fluorogenic 5' exonuclease activity of Taq polymerase to measure the amount of target sequences in cDNA samples (see also 19 Svanvik, 2000 for light-up probes).
TaqMan probes are oligonucleotides longer than the primers (20-30 bases long with a Tm value of 10 oC higher) that contain a fluorescent dye usually on the 5' base, and a quenching dye (usually TAMRA) typically on the 3' base (TaqMan MGB probes have a non-fluorescent quencher and minor groove binder at the 3' end). When irradiated, the excited fluorescent dye transfers energy to the nearby quenching dye molecule rather than fluorescing. Thus, the close proximity of the reporter and quencher prevents emission of any fluorescence while the probe is intact. TaqMan probes are designed to anneal to an internal region of a PCR product. When the polymerase replicates a template on which a TaqMan probe is bound, its 5' exonuclease activity cleaves the 5' end of probe which contains the reporter dye 22 (Holland, 1991). This ends the activity of quencher and the reporter dye starts to emit fluorescence which increases in each cycle proportional to the rate of probe cleavage. Accumulation of PCR products is detected by monitoring the increase in fluorescence of the reporter dye (note that primers are not labeled). TaqMan assay uses universal thermal cycling parameters and PCR reaction conditions. Because the cleavage occurs only if the probe hybridizes to the target, the origin of the detected fluorescence is specific amplification. The process of hybridization and cleavage does not interfere with the exponential accumulation of the product. One specific requirement for fluorogenic probes is that there be no G at the 5' end. A 'G' adjacent to the reporter dye quenches reporter fluorescence even after cleavage. Well-designed TaqMan probes require very little optimization.

Figure 3: Example of a Taqman Probe.
Molecular beacons also contain fluorescent (FAM, TAMRA, TET, ROX) and quenching dyes (typically DABCYL) at either end but they are designed to adopt a hairpin structure while free in solution to bring the fluorescent dye and the quencher in close proximity for FRET to occur. They have two arms with complementary sequences that form a very stable hybrid or stem. The close proximity of the reporter and the quencher in this hairpin configuration suppresses reporter fluorescence. When the beacon hybridizes to the target during the annealing step, the reporter dye is separated from the quencher and the reporter fluoresces. Molecular beacons remain intact during PCR and must rebind to target every cycle for fluorescence emission. This will correlate to the amount of PCR product available. All real-time PCR chemistries allow detection of multiple DNA species (multiplexing) by designing each probe/beacon with a spectrally unique fluor/quench pair, or if SYBR green is used by melting curve analysis. By multiplexing, the target(s) and endogenous control can be amplified in single tube for qPCR purposes.
Figure 4: Example of a Molecular beacon
With Scorpion primer/probes, sequence-specific priming and PCR product detection is achieved using a single oligonucleotide. The Scorpion probe maintains a stem-loop configuration in the unhybridized state. The fluorophore is attached to the 5' end and is quenched by a moiety coupled to the 3' end. The 3' portion of the stem also contains sequence that is complementary to the extension product of the primer. This sequence is linked to the 5' end of a specific primer via a non-amplifiable monomer. After extension of the Scorpion primer, the specific probe sequence is able to bind to its complement within the extended amplicon thus opening up the hairpin loop. This prevents the fluorescence from being quenched and a signal is observed (see also How It Works).
Figure 5. Example of a Scorpion probe.
FRET PROBES:
FRET Probes rely on the transfer of Energy from one fluorescent dye to another. Two separate sequence specific oligos are fluorescently labeled. The upstream probe has a donor molecule on the 3'- end and the downstream probes has an acceptor molecule on the 5'-end. The probes are designed so that they hybridize adjacently to each other on the target sequence and bring the donor and acceptor fluorophores in close proximity (figure 5). Once the probes are hybridized, the donor and acceptor fluorescent molecules are in close proximity to one another. This allows for transfer of energy from the donor to the acceptor fluorophore, which emits a signal of a different wavelength. Either the decrease in the fluorescence of the donor or the increase in fluorescence of the acceptor can be detected. Therefore, only when both probes are bound is fluorescence detectable. FRET probes do allow for melt curve analysis. They are extremely useful for Genotyping, SNP detection and other mutation detections.

Figure 6. Example of FRET probes.
(Wittwer, 1997b; van der Velden, 2003).
The cheaper alternative is the double-stranded DNA binding dye chemistry, which quantitates the amplicon production (including non-specific amplification and primer-dimer complex) by the use of a non-sequence specific fluorescent intercalating agent (SYBR-green I or ethidium bromide). It does not bind to ssDNA. SYBR green is a fluorogenic minor groove binding dye that exhibits little fluorescence when in solution but emits a b fluorescent signal upon binding to double-stranded DNA (Morrison, 1998). Disadvantages of SYBR green-based real-time PCR include the requirement for extensive optimization. Furthermore, non-specific amplifications require follow-up assays (melting point or dissociation curve analysis) for amplicon identification (Ririe, 1997). The method has been used in HFE-C282Y genotyping (Donohoe, 2000). Another controllable problem is that longer amplicons create a ber signal (if combined with other factors, this may cause CDC camera saturation. Normally SYBR green is used in single-plex reactions, however when coupled with melting curve analysis, it can be used for multiplex reactions (Siraj, 2002).

Figure 7: Example of Sybr Green-1 Binding to to dsDNA.
The threshold cycle or the CT value is the cycle at which a significant increase in µRn is first detected (for definition of µRn, see below and glossary). The threshold cycle is when the system begins to detect the increase in the fluorescent signal associated with an exponential growth of PCR product during the log-linear phase. This phase provides the most useful information about the reaction (certainly more important than the end-point). The slope of the log-linear phase reflects the amplification efficiency (Eff). Eff can be calculated by the formula:
Eff = 10(-1/slope) - 1The efficiency of the PCR should be 90 - 100% (- 3.6 > slope > – -3.1). A number of variables can affect the efficiency of the PCR (Bustin, 2004; Wong, 2005; Yuan, 2006). These factors include length of the amplicon, secondary structure and primer quality. Although valid data can be obtained that fall outside of the efficiency range, the qRT-PCR should be further optimized or alternative amplicons designed (see Efficiency Determination Page by Pfaffl). For the slope to be an indicator of real amplification (rather than signal drift), there has to be an inflection point. This is the point on the growth curve when the log-linear phase begins. It also represents the greatest rate of change along the growth curve. (Signal drift is characterized by gradual increase or decrease in fluorescence without amplification of the product.) The important parameter for quantitation is the CT. The higher the initial amount of genomic DNA, the sooner accumulated product is detected in the PCR process, and the lower the CT value. The threshold should be placed above any baseline activity and within the exponential increase phase (which looks linear in the log transformation). Some software allows determination of the cycle threshold (CT) by a mathematical analysis of the growth curve. This provides better run-to-run reproducibility. A CT value of 40 or higher means no amplification and this value cannot be included in the calculations. Besides being used for quantitation, the CT value can be used for qualitative analysis as a pass/fail measure.
Relative gene expression comparisons work best when the gene expression of the chosen endogenous/internal control is more abundant and remains constant, in proportion to total RNA, among the samples. By using an invariant endogenous control as an active reference, quantitation of an mRNA target can be normalized for differences in the amount of total RNA added to each reaction. For this purpose, the most common choices are 18S RNA, GAPDH (glyceraldehyde-3-phosphate dehydrogenase) and ß-actin. Because the 18S mRNA does not have a poly-A tail, cDNA synthesis using oligo-dT should not be used if 18S RNA will be used as a normalizer. The issue of the choice of a normalizer has been reviewed by Suzuki et al. (Suzuki, 2000). The authors recommend caution in the use of GAPDH as a normalizer as it has been shown that its expression may be upregulated in proliferating cells. They recommend ß-actin as a better active reference. GAPDH is severely criticized as a normalizer by others too (Bustin SA, 2000; Dheda, 2004; Aerts, 2004). GAPDH is particularly an unpopular choice in cancers because of its increased expression in aggressive cancers (Goidin, 2001). Caution should also be exercised when 18S RNA is used as a normalizer as it is a ribosomal RNA species (not mRNA) and may not always represent the overall cellular mRNA population. Since the chosen mRNA species should be proportional to the amount of input RNA, it may be best to use a combination as normalizer. It is desirable to validate the chosen normalizer for the target cell or tissue. It should be expressed at a constant level at different time points by the same individual and also by different individuals at the target cell or tissue (for example, peripheral blood lymphocytes) (Dheda, 2004). This aim can be achieved by the ABI TaqMan Human Endogenous Control Plate, geNorm kit or TATAA Biocenter Endogenous Control Gene Panel which evaluate the expression of select housekeeping genes. Our own experience showed that ß-actin or 18S RNA are the best choices as normalizers for the peripheral blood mononuclear cells, whereas GAPDH performed worst in transplant monitoring studies. Similar concerns on the choice of normalizers in transplant monitoring have also been expressed by others (Gibbs, 2003). Surveys of tumor cell lines or tissues reported the worst results with GAPDH while beta-glucuronidase (GUS) and 18S rRNA were the best choices for this target (Aerts, 2004) or HPRT (de Kok, 2004). It is important to choose a normalizer whose expression will remain constant under the experimental conditions designed for the target gene (Schmittgen, 2000; Dheda, 2005). Another study found that for robust conclusions the use of multiple internal controls is the best choice (18S rRNA and cyclophilin) for kidney mRNA expression studies (Schmid, 2003). The strategy of using multiple and variable normalizer genes depending on the cell and tissue type is validated for general use (Vandesompele, 2002). (See Ambion: 18S RNA as an Internal Control; Ambion: GAPDH, ß-actin, cyclophilin, 18S RNA as internal controls; EXPOLDB: The most constantly expressed housekeeping genes; algorithms to select the best endogenous controls: geNORM (Vandesompele, 2002), NormFinder (Andersen, 2004), and qBasePlus (Hellemans, 2007).
Multiplex TaqMan assays can be performed using multiple dyes with distinct emission wavelengths. Available dyes for this purpose are FAM, TET, VIC and JOE (the most expensive). TAMRA is reserved as the quencher on the traditional TaqMan probes and ROX as the passive reference. For best results, the combination of FAM (target) and VIC (endogenous control) is recommended (they have the largest difference in emission maximum) whereas JOE and VIC should not be combined. It is important that if the dye layer has not been chosen correctly, the machine will still reading the other dye's spectrum. For example, both VIC and FAM emit fluorescence in a similar range to each other and when doing a single dye, the wells should be labeled correctly.
One-step real-time RT-PCR performs reverse transcription and PCR in a single buffer system and in one tube. In two-step RT-PCR, these two steps are performed separately in different tubes.
General recommendations for Real Time PCR
1. Use positive-displacement pipettes to avoid inaccuracies in pipeting.
2. The sensitivity of real-time PCR allows detection of the target in 2 pg of total RNA. The number of copies of total RNA used in the reaction should ideally be enough to give a signal by 25-30 cycles (preferably less than 100 ng). The amount used should be decreased or increased to achieve this.
3. The optimal concentrations of the reagents are as follows:
i. Magnesium chloride concentration should be between 4 and 7 mM.
ii. Concentrations of dNTPs should be balanced with the exception of dUTP (if used). Substitution of dUTP for dTTP for control of PCR product carryover requires twice dUTP that of other dNTPs. While the optimal range for dNTPs is 500 µM to 1 mM (for one-step RT-PCR), for a typical TaqMan reaction (PCR only), 200 µM of each dNTP (400 µM of dUTP) is used.
iii. Typically 0.25 µL (1.25 U) AmpliTaq DNA Polymerase (5.0 U/µL) is added into each 50 µL reaction. This is the minimum requirement. If necessary, optimization can be done by increasing this amount by 0.25 U increments.
iv. The optimal probe concentration is 50-200 nM, and the primer concentration is 100-900 nM. Ideally, each primer pair should be optimized at three different temperatures (58, 60 and 620 C for TaqMan primers) and at each combination of three concentrations (50, 300, 900 nM). This means setting up three different sets (for three temperatures) with nine reactions in each (50/50 mM, 50/300 mM, 50/900, 300/50, 300/300, 300/900, 900/50, 900/300, 900/900 mM) using a fixed amount of target template. If necessary, a second round of optimization may improve the results. Optimal performance is achieved by selecting the primer concentrations that provide the lowest CT and highest µRn. Similarly, the probe concentration should be optimized for 25-225 nM.
5. AmpErase uracil-N-glycosylase (UNG) is added in the reaction to prevent the reamplification of carry-over PCR products by removing any uracil incorporated into amplicons. This is why dUTP is used rather than dTTP in PCR reaction. UNG does not function above 55oC and does not cut single-stranded DNA with terminal dU nucleotides (Longo, 1990). UNG-containing master mix should not be used with one-step RT-PCR unless rTth DNA polymerase is being used for reverse transcription and PCR (TaqMan EZ RT-PCR kit).
6. It is necessary to include at least three No Amplification Controls (NAC, a minus-reverse transcriptase control) as well as three No Template Controls (NTC, a minus sample control) in each reaction plate (to achieve a 99.7% confidence level in the definition of +/- thresholds for the target amplification, six replicates of NTCs must be run). NAC is a mock reverse transcription containing all the RT-PCR reagents, except the reverse transcriptase; NTC includes all of the RT-PCR reagents except the RNA template. It is necessary to rule out the presence of fluorescence contaminants in the sample or in the heat block of the thermal cycler (these would cause false positives). No product should be synthesized in the NTC or NAC; if a product is amplified, it indicates that one or more of the RT-PCR reagents is contaminated with DNA which may be the amplicon. If the absolute fluorescence of the NAC is greater than that of the NTC after PCR, fluorescent contaminants may be present in the sample or in the heating block of the thermal cycler.
7. The dynamic range of a primer/probe system and its normalizer should be examined if the µCT method is going to be used for relative quantitation. The linear dynamic range refers to the range of initial template concentrations over which accurate CT values are obtained. This is determined by running (in triplicate) reactions of five RNA concentrations (for example, 0, 80 pg/µL, 400 pg/µL, 2 ng/µL and 50 ng/µL). The resulting plot of log of the initial amount vs CT values (standard curve) should be a (near) straight line for both the target and normalizer real-time PCRs for the same range of total RNA concentrations.
8. The passive reference is a dye (ROX) included in the reaction (present in the TaqMan universal PCR master mix). It does not participate in the 5' nuclease reaction. It provides an internal reference for background fluorescence emission. This is used to normalize the reporter-dye signal. This normalization is for non-PCR-related fluorescence fluctuations occurring in different wells (concentration or volume differences, bubbles) or over time and different from the normalization for the amount of cDNA or efficiency of the PCR. Normalization is achieved by dividing the emission intensity of reporter dye by the emission intensity of the passive reference. This gives the ratio defined as Rn. Not using ROX or not designating it as the passive reference dye in the analysis may cause trailing of the clusters in the allelic discrimination plot.
9. In addition to the use of ROX, a master mix should be used when setting up multiple reactions to minimize sample-to-sample and well-to-well variation and improve reproducibility (ROX will be within the master mix).
10. If multiplexing is done, the more abundant of the targets will use up all the ingredients of the reaction before the other target gets a chance to amplify. To avoid this, the primer concentrations for the more abundant target should be limited.
11. If SYBR green is used, dissociation (melting) curve analysis should be performed. Ideally, the experimental samples should yield a sharp peak (first derivative plot) at the melting temperature of the amplicon, whereas the NAC and NTC will not generate significant fluorescent signal. This result indicates that the products are specific, and that SYBR Green I fluorescence is a direct measure of accumulation of the product of interest. If the dissociation curve has a series of peaks, there is not enough discrimination between specific and non-specific reaction products. To obtain meaningful data, optimization of the RT-PCR would be necessary.
At the end of each reaction, the recorded fluorescence intensity is used for the following calculations by the software of the system used:
Rn+ is the Rn value of a reaction containing all components (the sample of interest); Rn- is the Rn value detected in NTC (baseline value). µRn is the difference between Rn+ and Rn-. It is an indicator of the magnitude of the signal generated by the PCR. It is the µRn plotted against cycle numbers that produces the amplification curves and gives the CT value.
There are different approaches to quantitate the amount of template (Livak, 2001):
1. Absolute standard curve method: Absolute quantification determines the input copy number of the transcript of interest, usually by relating the PCR signal to a standard curve. In this method, a standard curve is first constructed from an RNA of known concentration. This curve is then used as a reference standard for extrapolating quantitative information for mRNA targets of unknown concentrations. cDNA plasmids are the preferred standards for absolute quantitation. This method has been used to estimate cytokine concentrations (Giulietti, 2001), CMV (Kearns, 2001a; Kearns, 2001b; Kearns, 2002; Mengelle, 2003), HIV (Gibellini, 2004) and other viral loads (Niesters, 2001), (Saha, 2001). See Bustin, 2000 for a review; and Absolute Quantification Page by Pfaffl.
2. Relative standard method (relative fold change): In this method, one of the experimental samples is the calibrator, or 1x sample. Each of the normalized target values is divided by the calibrator normalized target value to generate the relative expression levels. Target quantity is determined from the standard curve and divided by the target quantity of the calibrator. The calibrator is the 1x sample, and all other quantities are expressed as an n -fold difference relative to the calibrator. The calibrator is usually the expression level at baseline and the experimental samples are those collected after treatment or some intervention. The calibrator should be available at large enough quantities to be included in each run. See Relative Quantification Page by Pfaffl.
3. Comparative threshold (CT) method: This method uses no known amount of standard but compares the relative amount of the target sequence to any of the reference values chosen and the result is given as relative to the reference value (such as the expression level of resting lymphocytes or a standard cell line or in comparison to the baseline value). For the CT calculation to be valid, the efficiency of the target amplification and the efficiency of the reference amplification must be approximately equal. A sensitive method for assessing if two amplicons have the same efficiency is to look at how CT varies with template dilution. Before using the µCT method for quantitation, a validation experiment is performed to demonstrate that efficiencies of target and reference are approximately equal. Serial dilutions of the target and normalizer are prepared and real-time PCR is run in separate tubes. The CT values for each dilution of the target and the normalizer are obtained and their difference for each dilution is calculated (µCT). Then, a plot of log input (like from 0.01 ng to 1 ng) amount versus µCT is prepared. If the efficiencies of the two amplicons are approximately equal, the plot of log input amount versus µCT has a slope of approximately zero (the absolute value of the slope of log input amount vs CT should be < 0.1). This method has been used in monitoring the immune system activity after transplantation (Sabek, 2002). See Livak & Schmittgen, 2001 for a review; and ABI-7700 User Bulletin #2 for the details of quantitation methods.
The comparative CT method (µCT) for relative quantitation of gene expression. This method enables relative quantitation of template and increases sample throughput by eliminating the need for standard curves when looking at expression levels relative to an active reference control (normalizer). For this method to be successful, the dynamic range of both the target and reference should be similar. A sensitive method to control this is to look at how µCT (the difference between the two CT values of two PCRs for the same initial template amount) varies with template dilution. If the efficiencies of the two amplicons are approximately equal, the plot of log input amount versus µCT will have a nearly horizontal line (a slope of < 0.10). This means that both PCRs perform equally efficiently across the range of initial template amounts. If the plot shows unequal efficiency, the standard curve method should be used for quantitation of gene expression. The dynamic range should be determined for both (1) minimum and maximum concentrations of the targets for which the results are accurate and (2) minimum and maximum ratios of two gene quantities for which the results are accurate. In conventional competitive RT-PCR, the dynamic range is limited to a target-to-competitor ratio of about 10:1 to 1:10 (the best accuracy is obtained for 1:1 ratio). The real-time PCR is able to achieve a much wider dynamic range.
Running the target and endogenous control amplifications in separate tubes and using the standard curve method requires the least amount of optimization and validation. The advantage of using the comparative CT method is that the need for a standard curve is eliminated (more wells are available for samples). It also eliminates the adverse effect of any dilution errors made in creating the standard curve samples.
As long as the target and normalizer have similar dynamic ranges, the comparative CT method (µCT method) is the most practical method. It is expected that the normalizer will have a higher expression level than the target (thus, a smaller CT value). The calculations for the quantitation start with getting the difference (µCT) between the CT values of the target and the normalizer:
µCT = CT (target) - CT (normalizer/calibrator/reference)This value is calculated for each sample to be quantitated (unless, the target is expressed at a higher level than the normalizer, this should be a positive value. It is no harm if it is negative). One of these samples should be chosen as the reference (baseline) for each comparison to be made. The comparative µCT calculation involves finding the difference between each sample's µCT and the baseline's µCT. If the baseline value is representing the minimum level of expression, the µCT values are expected to be negative (because the µCT for the baseline sample will be the largest as it will have the greatest CT value). If the expression is increased in some samples and decreased in others, the DDCT values will be a mixture of negative and positive ones. The last step in quantitation is to transform these values to absolute values. The formula for this is:
comparative expression level = 2 - µCtFor expressions increased compared to the baseline level this will be something like 23 = 8 times increase, and for decreased expression it will be something like 2-3 = 1/8 of the reference level. Microsoft Excel can be used to do these calculations by simply entering the CT values (there is an online ABI tutorial on the use of spread sheet programs to produce amplification plots; the TaqMan Human Endogenous Control Plate protocol also contains detailed instructions on using MS Excel for real-time PCR data analysis). A more accurate method of relative quantification using the relative expression ratio is presented by Pfaffl (Pfaffl, 2001).
The quantification methods are outlined in the ABI User Bulletins. The Bulletins #2 and #5 are most useful for the general understanding of real-time PCR and quantification.
Advantages of Real Time PCR
![]() Traditional PCR is measured at end-point (plateau), while real-time PCR collects data in the exponential growth phase.
Traditional PCR is measured at end-point (plateau), while real-time PCR collects data in the exponential growth phase.
![]() An increase in reporter fluorescent signal is directly proportional to the number of amplicons generated.
An increase in reporter fluorescent signal is directly proportional to the number of amplicons generated.
![]() The cleaved probe provides a permanent record amplification of an amplicon.
The cleaved probe provides a permanent record amplification of an amplicon.
![]() Increased dynamic range of detection.
Increased dynamic range of detection.
![]() Requirement of 1000-fold less RNA than conventional assays.
Requirement of 1000-fold less RNA than conventional assays.
![]() No-post PCR processing due to closed system (no electrophoretical separation of amplified DNA).
No-post PCR processing due to closed system (no electrophoretical separation of amplified DNA).
![]() Detection is capable down to a 2-fold change.
Detection is capable down to a 2-fold change.
![]() Small amplicon size results in increased amplification efficiency.
Small amplicon size results in increased amplification efficiency.